


We love the Web. We’ve been using the Internet in various forms since the 90’s. We believe that the increasing amount of information should be structured beforehand by the same individuals that create the content.
With this idea in mind and willing to empower journalists and bloggers we’ve created WordLift: a semantic editor for WordPress.
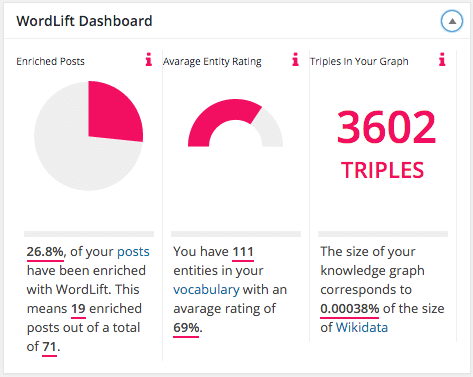
With the latest release (version 3.4) we are introducing a Dashboard to provide a quick overview of the website’s Knowledge Graph.

What the heck is a Knowledge Graph?
Knowledge Graphs are all around us. Internet giants like Google, Facebook, LinkedIn and Amazon they are all running their own Knowledge Graphs and willingly or not we are all contributing to them.
Knowledge Graphs are networks of all kind of things which are relevant to a specific knowledge domain or within an organization. They contains abstract concepts and relations as well as instances of all sort of ‘things’ including persons, companies, documents and datasets.
Knowledge Graphs are intelligent data models made of descriptive metadata that can be used to categorise contents.
Why should You bring all your content and data in a Knowledge Graph?
The answer is simple. You want to be relevant for your audience. A Knowledge Graph allows machines (including voice-enabled assistants, smartphone apps and search crawlers) to make complex queries over the entirety of your content. Let’s break this down into benefits:
- Facilitate smarter and more relevant search results and recommendations
- Support intelligent personal assistant like Apple Siri and Google Now understand natural language requests by providing the needed vocabulary to identify content
- Get richer insights on how content is performing and is being received by the audience. Someone calls it Semantic Analytics (more on this topic soon)
- Sell advertising more wisely by providing in-depth context to advertising networks
- Create new services that drive reader engagement
- Share (or sell) metadata to the rest of the World
So what makes WordLift special
WordLift allows anyone to build his/her own Knowledge Graph. The plugin adds a layer of structured metadata to the content you write on WordPress. Every article is classified with named entities and these classifications are used to provide relevant recommendations that boost the articles of your site with widgets like the navigator and the faceted search. There is more.
The deep vocabulary can be used to understand natural language requests like – “Who is the founder of company [X]?”. Let’s dig deeper. Here is an example that uses a generalist question answering tool called Platypus.
Playtypus leverages on the Wikidata Knowledge Graph. Now if I would ask “Who is the founder of Insideout10?” Wikidata, would probably politely answer “I’m sorry but I don’t have this information“.
Now, the interesting part is that, for this specific question, this same blog holds the correct answer.
As named entities are described along with their properties I can consult the metadata about Insideout10and eventually have applications like Platypus run a SPARQL query on my graph.
This query returns two entities:
- http://data.redlink.io/91/be9/entity/andrea_volpini
- http://data.redlink.io/91/be9/entity/david_riccitelli
Who owns the data?
The site owner does. Every website has its own graph published on data.wordlift.it (or any custom domain name you might like) and the creator of the website holds all licensing rights of his/her data. In the next upcoming release a dedicated rights statement will be added to all graphs published with WordLift (here you’ll find the details of this issue).
So how big is this graph?
If we combine all existing beta testers we reach a total of 37.714 triples (this being the unit of measurement of information stored in a Knowledge Graph). Here is a chart representing this data.

While this is a very tiny fraction of the World’s knowledge (Wikidata holds 975.989.631 of triples – here is a simple query to check this information on their systems) it is relevant for the readers’ of this blog and contributes to the veracity of big data (“Is this data accurate?”).
Happy blogging!